skip to main | skip to sidebar

Sunday, July 6, 2008

Similarity Matrix


http://images.google.com/imgres?imgurl=http://www.lems.brown.edu/vision/people/leymarie/Refs/CompVision/Ridges/Figs/similar.gif&imgrefurl=http://www.lems.brown.edu/vision/people/leymarie/Refs/CompVision/Ridges/Shinagawa.html&h=594&w=731&sz=78&hl=en&start=8&tbnid=5SEo0mmVgBwleM:&tbnh=115&tbnw=141&prev=/images%3Fq%3Dsimilarity%2Bmatrix%26gbv%3D2%26hl%3Den

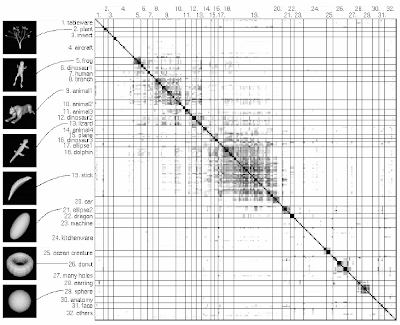
The above image is a similarity matrix of 230 different models divided into 32 different categories. The darker squares indicates the models that are higher in similarity. A similarity matrix shows similarity between two different models.
Posted by Dianie at 8:58 PM

No comments:

Post a Comment

Newer Post Older Post Home
Subscribe to: Post Comments (Atom)

Map Catalog

Blog Archive

  • ▼  2008 (54)
    • ▼  July (16)
      • Star Plots
      • Correlation Matrix
      • Similarity Matrix
      • Stem and Leaf Plot
      • Box Plot
      • Histogram
      • Parallel Coordinate Graph
      • Triangular Plot
      • Wind Rose
      • Climograph
      • Population Profile
      • Scatter Plot
      • Index Value Plot
      • Accumulataive Line Graph (Lorenz Curve)
      • Bilateral Graph
      • Nominal Area Choropleth Map
    • ►  June (28)
    • ►  May (10)

About Me

Dianie
Happily married, total of four children with one grandchild, one dog, work full-time, school part-time.
View my complete profile