 http://images.google.com/imgres?imgurl=http://www.humble-inc.com/rof_pic4.gif&imgrefurl=http://www.humble-inc.com/rof.htm&h=311&w=342&sz=5&hl=en&start=5&tbnid=K7uuhLTzqdmZFM:&tbnh=109&tbnw=120&prev=/images%3Fq%3Dstar%2Bplot%26gbv%3D2%26hl%3Den
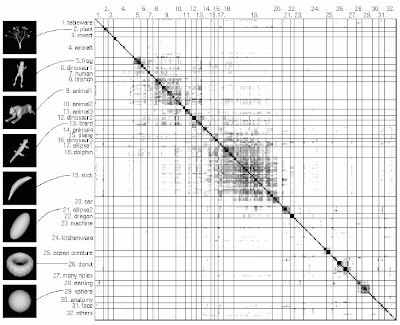
The above image is a star plot showing as noted above polar plot of peak height retions of oils #1 and #2 are the same and oil #3 is different. The ratios are plotted on a star to show the differences. A star plot is a graphical data analysis technique for examining the similarities or differences of all the variables in the data set.


